The iostat command has many different options for it to be executed. However, the basic syntax of the command is as follows:
iostat [ options ] [ <interval> [ <count> ] ] ]
Although it is also possible to run it without any parameters and it will give us the following output on the screen:
Linux 5.4.0-65-generic (imaginelinux) 	03/20/2021 	_x86_64_	(1 CPU)

avg-cpu:  %user   %nice %system %iowait  %steal   %idle
           4.49    0.00    1.75    0.32    0.00   93.45

Device             tps    kB_read/s    kB_wrtn/s    kB_dscd/s    kB_read    kB_wrtn    kB_dscd
sda              15.47       281.02      1453.92         0.00     147424     762728          0
This first iostat report is easy to interpret, but let’s take it in parts.
The first section is dedicated to the system but with quite basic information that serves as a preamble to the report as such. The information shown is the Kernel version, hostname, system date, system type, and the number of processor cores.
In the second section of the report we find information about the CPU of the computer and the following values:
- %user: Percentage of CPU usage at the normal user level.
- %nice: Show the percentage of CPU usage at the user level with priorities.
- %system: Show the percentage of CPU utilization that occurred while executing at the system level (kernel).
- %iowait: This value shows the percentage of time that the CPUs were idle and the system received I/O requests.
- %steal: Show the percentage of time spent in involuntary wait by the virtual CPU or CPUs while the hypervisor was servicing another virtual processor.
- %idle: Show the percentage of time that the CPU or CPUs were idle and the system did not have an outstanding disk I/O request.
The third section of the report is what we are looking for which is a report on the I/O devices that we have.
- Device: Refers to the device from which the data originates.
- tps: Indicate the number of transfers per second that were issued to the device. A transfer is an I/O request to the device. Multiple logical requests can be combined into a single I/O request to the device. A transfer is of indeterminate size
- kb_read/s Indicate the amount of data read from the device expressed in kilobytes per second.
- kB_wrtn/s: Indicate the amount of data written to the device expressed in kilobytes per second.
- kB_read: The total number of kilobytes read.
- kB_wrtn: The total number of kilobytes written.
Example of use
Obtain more comprehensive statistics
The most common use of iostat is with the x option which gives us a more detailed report.
iostat -x
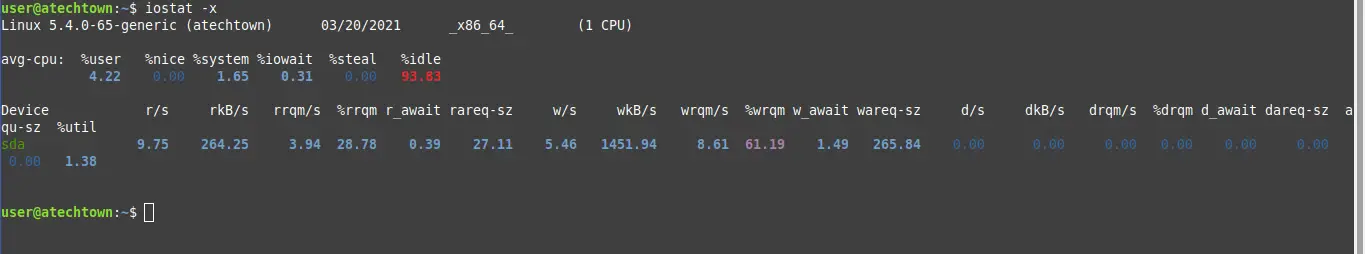
This way we will have more columns that show even more information about it.
Get CPU statistics only
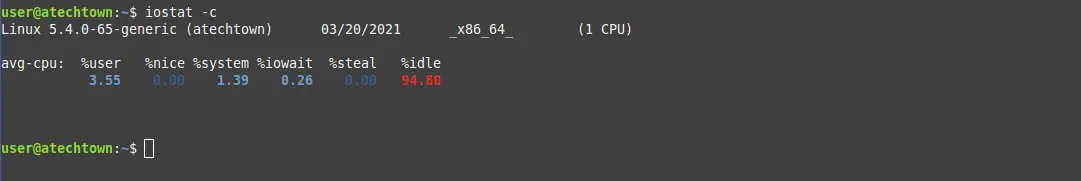
There are times when it is convenient to omit other reports and just keep the CPU report, for that there is the -c option.
iostat -c
Device statistics only
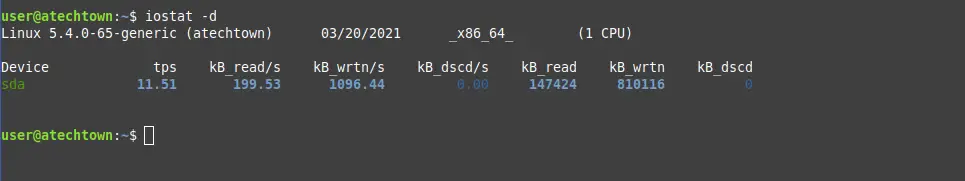
On the other hand, it is also possible to show only the device statistics.
iostat -d
Using interval information
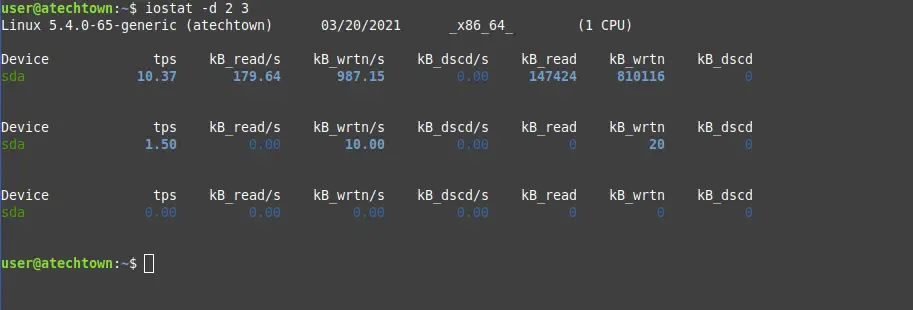
One of the most interesting capabilities of the iostat command is that we can get a certain amount of reports in a certain time range.
In this example, I will request three reports from the device with an interval of two seconds.
iostat -d 2 3
You can even use the -m option to change the unit of measure to Mb.
iostat -md 2 3
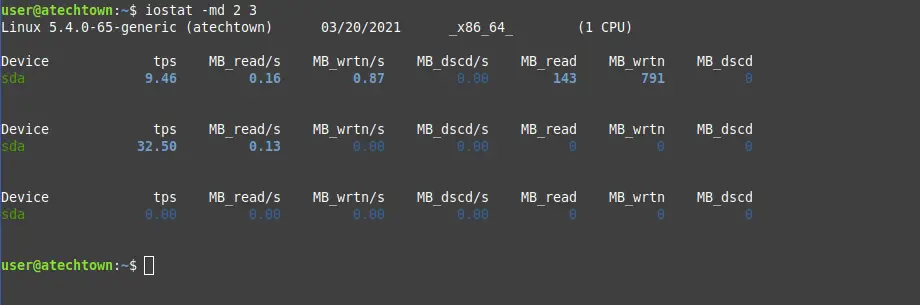
This way you can get a more readable report.
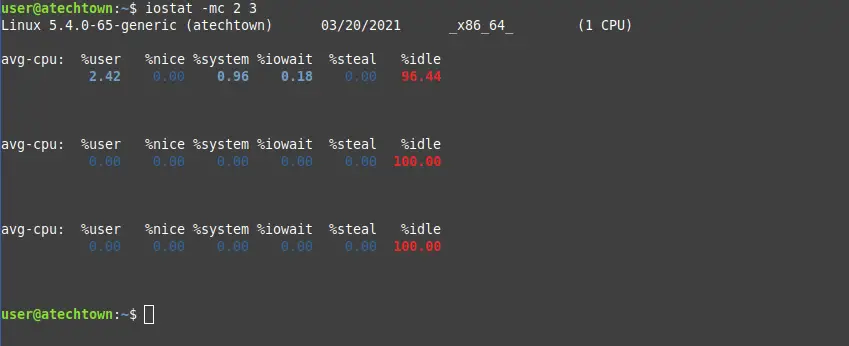
Likewise, you can request an interval report for the cpu with the -c option.
iostat -mc 2 3
Obtain a block output
Finally, it is possible to obtain a more ordered block output by using the -p option.
iostat -p
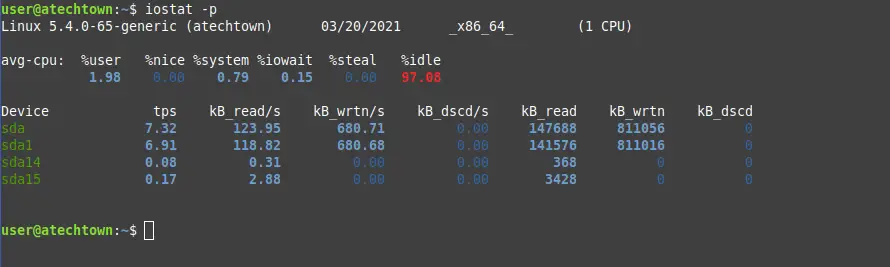
So you can manage it in a better way.
Conclusion
Iostat is a fairly simple command to use but it can be quite useful if we want to know how our disk is being used. Especially useful in environments where there is known to be a lot of incoming and outgoing traffic it can give us important metrics on how the disk is performing. In this post, we have shown you with some examples the simplicity and greatness of the command.
More info: The iostat documentation and more tutorial about Linux Commands