In Linux, there are commands for everything. There is even one that will help us monitor the system in a basic way. That is why we will examine the Linux top command.
The top command is used to monitor a Linux system from the terminal. With this command, you can know the CPU load, RAM usage, and Swap, as well as get a list of running processes. It is one of the easiest commands to use but can be quite useful in production situations.
One of the great advantages of this command is that it is available for any Linux distribution. This is appreciated because we do not have to install anything else that can slow down the system.
Using the Linux Top Command
Open a terminal on your computer. It’s also good if you’re using a remote server, though.
Then, just run the command.
:~$ top
If you wish to exit the command, simply press the q key.
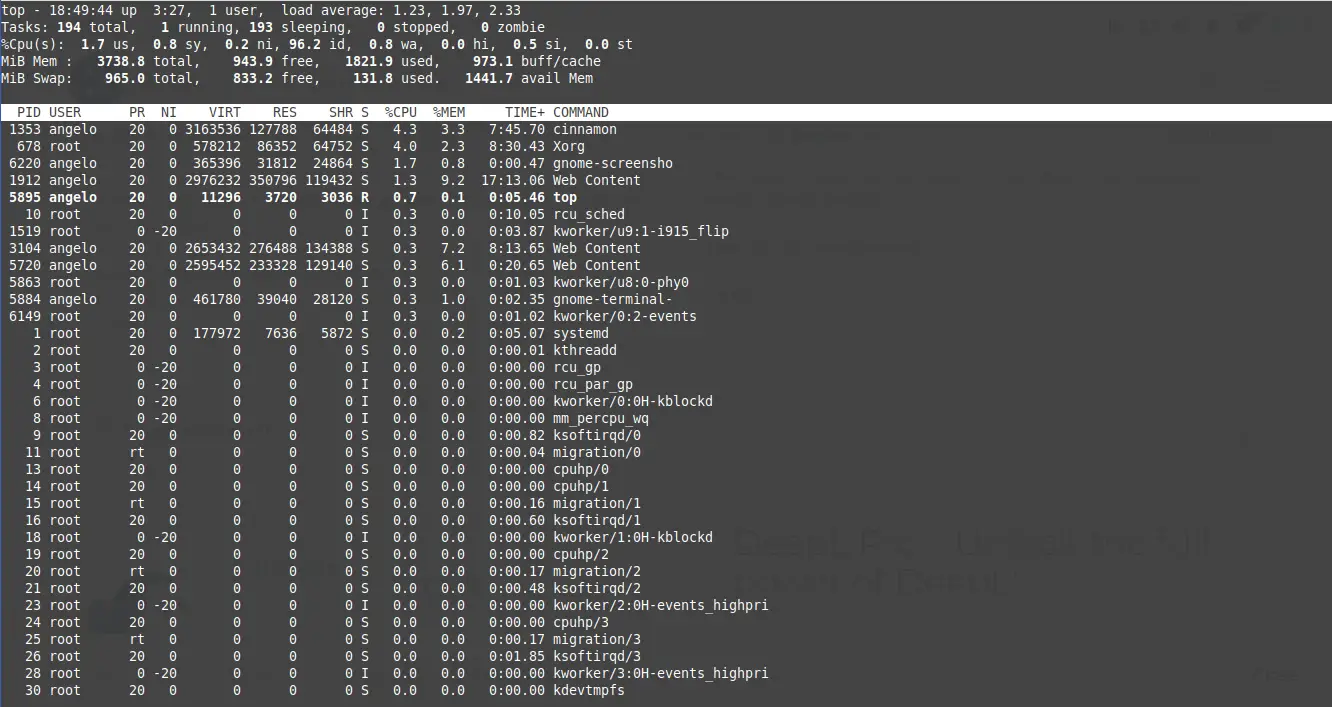
Now, the terminal has been transformed into a bunch of numbers and processes. Actually, this is all information we’ll be explaining.
The first line in my system after you execute the command is:
top - 18:53:21 up 3:30, 1 user, load average: 0.48, 1.33, 2.00
- 18:53:21 is the system time.
- 3:30 is the time the system has been on.
- There is currently only one active user in the system.
- And at the end, the processor load average is displayed in 5, 10, and 15-minute intervals.
So, the next line is:
Tasks: 198 total, 1 running, 197 sleeping, 0 stopped, 0 zombie
This line refers to the tasks that the system has. In total, I have 198. Only 1 running, 197 sleeping (waiting to be executed), none arrested and none as a zombie.
Next, we find the line of the CPU usage, according to its use.
%Cpu(s): 9.1 us, 1.4 sy, 0.0 ni, 87.6 id, 0.9 wa, 0.0 hi, 1.1 si, 0.0 st
- 9.1 by the user.
- 1.4 by the system.
- 87.6 inactive.
- 0.9 on standby.
- Also, none for hardware interruptions.
- 1.1 for software interruptions
So, you can also display the information for each CPU core, by pressing the 1 key.
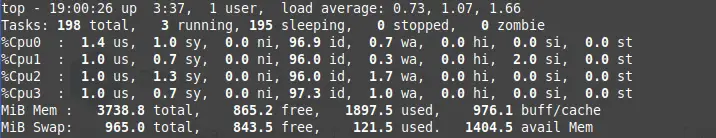
Next, the memory information:
MiB Mem : 3738.8 total, 884.8 free, 1857.8 used, 996.2 buff/cache
This section is easier to understand because it only shows the information of the total memory, amount in use, the amount available, and the amount in the buffer.
Now it is the turn of the Virtual memory and in this case, the Swap data is presented.
MiB Swap: 965.0 total, 849.2 free, 115.8 used. 1428.9 avail Mem
So, this section presents the total Swap memory, how much is free, used, and the one for the cache.
The processes section on Top
Now comes the list of processes that are running. If you press the n key and then a number, you can define the number of processes to be displayed.
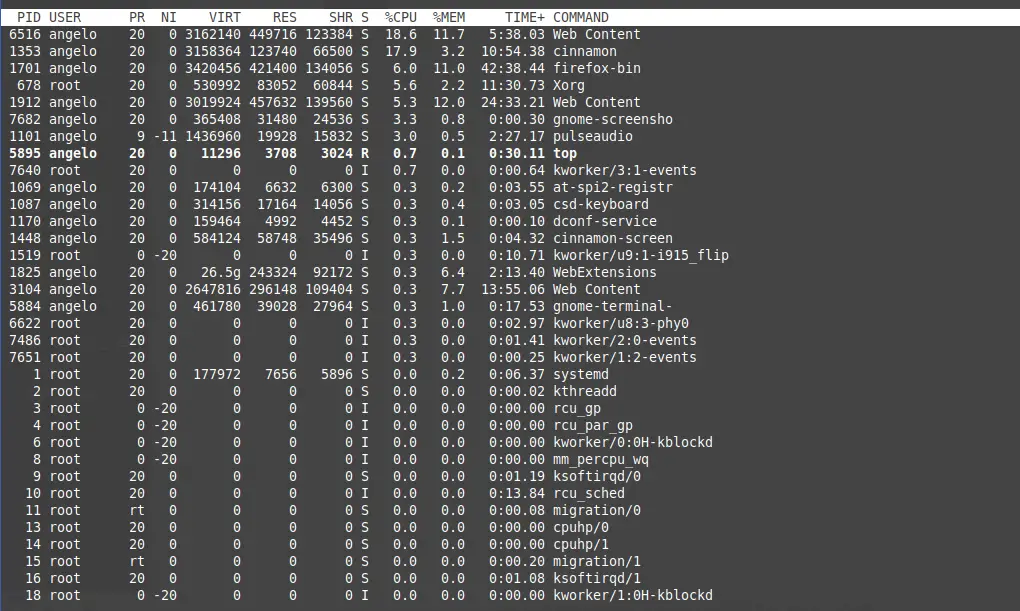
The columns in this section give information about the process:
- PID: Identifier of the process in the system.
- User: User that executes the process.
- PR: Priority of the process.
- NI: Priority assigner.
- VIRT: Amount of virtual memory used by the process.
- RES: Amount of physical memory used by the process.
- SHR: It refers to the shared memory.
- S: Status of the process.
- CPU: Percentage of CPU usage.
- MEM: Memory usage percentage.
- TIME+: Time the process has been using the CPU.
- COMMAND: Command that executes the process.
So as you can see this command is quite simple but very useful.
Conclusion
So as you can see the Top command is quite simple but very useful. Well, this command helps us to display system information and resources from the terminal, easily and quickly.
Also read: The Linux curl command